7.9 Other Considerations for IR Imaging
In this section, additional considerations users may have regarding WFC3/IR imaging are explored, including those that are determined to have little or no impact. We suggest that users pay particularly close attention to Section 7.9.1 (gain and full well saturation), Section 7.9.4 (image persistence), and Section 7.9.7 (optical anomalies).
7.9.1 Gain and Full-Well Saturation
Like the UVIS channel, the IR channel uses 16-bit analog-to-digital converters (ADCs), providing a digital output signal in the range between 0 and 65,535 data numbers (DNs). The default gain setting for the IR channel is 2.5 electrons/DN and is the only one offered to observers. In ground-based testing, the measured gain for this setting was 2.3 to 2.4 e−/DN, depending on quadrant (WFC3 ISR 2008-50). Values of 2.2 to 2.3 e−/DN were measured using internal flat field exposures taken from 2010 to 2015 (WFC3 ISR 2015-14) and from 2016 to 2023 (WFC3 Technical Instrument Report 2024-01, available upon request).
The default gain is chosen based on the full-well saturation level of the IR channel, which is about 78,000 electrons (~34,000 DN at the default gain), and on the detector readout noise, of order 20-22 electrons per correlated double sampling.
7.9.2 Cosmic Rays and Snowballs
Cosmic rays degrade the image quality. On-orbit measurements indicate that cosmic ray events occur at a rate of 11 ± 1.5 CR/s for WFC3/IR. The IR channel's MULTIACCUM mode, a series of intermediate non-destructive reads, makes it possible to filter out cosmic rays. The intermediate reads are used by the WFC3 data pipeline to identify cosmic ray hits, similar to the use of CR-SPLITs in CCD observations. AstroDrizzle also checks for and attempts to remove any residual cosmic rays from the “drizzled” images when there are multiple (usually dithered) exposures of the same field (see the DrizzlePac documentation).
Passages through the South Atlantic Anomaly (SAA) cause the highest number of cosmic ray hits. When the HST is within the predefined SAA exclusion zone, IR observations are not normally taken and the detector is set to auto-flush mode to minimize the effects of SAA passage on instrument performance. Unlike NICMOS, where it was necessary to switch off the detector electronics during SAA passage, it is possible to perform time-critical observations in the SAA with WFC3/IR although the cosmic ray rate will be high (about 12% of the pixels per minute (WFC3 ISR 2009-40).
Snowballs (named for their fuzzy appearance) are transient, extended sources that appear in IR exposures at the rate of about one per hour. They were characterized during ground-based testing (WFC3 ISR 2009-43) and were hypothesized to be caused by the emission of alpha particles by radioactive isotopes in the detector (WFC3 ISR 2009-44). The rate of appearance of snowballs has remained constant over 11 years of on-orbit observations, consistent with the hypothesis that the uranium-238 decay chain is the source (WFC3 ISR 2015-01, WFC3 ISR 2020-03). Typical snowballs affect about 8 to 25 pixels, saturate 2-5 of those, and deposit about 200,000 to 500,000 electrons on the detector. The energy is deposited in the pixels instantaneously, so snowballs can be removed like cosmic rays, via up-the-ramp fitting.
7.9.3 On-Orbit Degradation
Unlike the CCDs, minimal cosmic-ray damage to the IR detectors was anticipated, and essentially none has been observed. During ground testing using a particle accelerator, the WFC3/IR arrays were subjected to radiation doses much higher than expected in their entire orbital lifetime, without sustaining significant long-term damage or measurable degradation in QE. Searches for the development of new bad pixels are conducted as part of the regular calibration program; the number is growing slowly if at all (WFC3 ISR 2010-13, WFC3 ISR 2012-10, WFC3 ISR 2024-02). IR bad pixel tables are routinely generated and delivered for use in the automated calibration pipeline (WFC3 ISR 2019-03, WFC3 ISR 2022-01, and WFC3 ISR 2024-02). The median dark current shows no evolution over time (WFC3 ISR 2017-04, WFC3 ISR 2012-11) although the level can vary from ramp to ramp by about 0.03 e-/s (Section 5.7.2).
Initial in-flight dark reference files made from SMOV and Cycle 17 data were delivered in 2010 to replace the ground-based reference files. Since then, improved versions of the IR darks have been delivered on a periodic basis (e.g. WFC3 ISR 2010-16, WFC3 ISR 2019-04, WFC3 ISR 2024-16). Descriptions of the WFC3 reference files are available in Section 11 of the HST Reference Files Information Document.
7.9.4 Image Persistence
As discussed in Section 5.7.9, the WFC3/IR detector exhibits image persistence, particularly during and following observations of targets that saturate the detector by more than the pixel full well depth. The amount of image persistence depends primarily on the brightness of the amount of charge accumulated by a pixel in an exposure, and secondarily on the length of time in an exposure. There is also some dependence on the location on the detector. The underlying cause of this behavior is that the traps involved in persistence have finite trapping and release times.
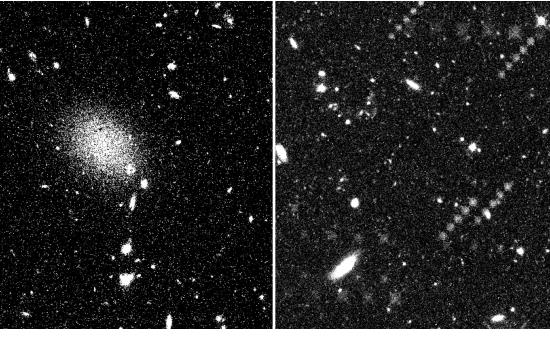
Image persistence has been observed within exposures in a single orbit as well as in observations where the target observed in a previous orbit was particularly bright, manifesting in the same pixels where the causing source previously landed. Two examples of persistence are shown in Figure 7.11. The left panel shows an image obtained with WFC3/IR in parallel to a COS exposure (Program 11519, Visit 01). The bright diffuse object in the center of the field is the persistence after-image of the nearby Sb galaxy NGC 2841 observed two hours earlier (Program 11360, Visit R1). The right panel shows an image obtained of the gamma ray burst GRB090423 (Program 11189, Visit H2) which followed observations of globular cluster 47 Tuc (Program 11677, Visit 19) and a stellar field in Orion (Program 11548, Visit AJ). The patterns seen stepping diagonally across the image are the result of the dither pattern used in the previous observations. Persistence caused by sources observed within the same visit is known as self-persistence and often contributes the strongest persistence signals due to temporal proximity.
Figure 7.11: Persistence evident in WFC3/IR exposures following exposures of a bright nearby galaxy (left) and following dithered exposures of two fields of bright stars (right).
Obvious examples of persistence such as that shown in Figure 7.11 are fairly rare in the HST data, as procedures were put in place to minimize their occurrence when possible. As part of the process of finalizing proposals for execution on-orbit, the WFC3 Contact Scientists (CS) perform detailed reviews of all submitted Phase II programs. For IR programs, the CS's flag visits that are likely to cause this much persistence so that the schedulers can inhibit WFC3/IR observations for several orbits after these “bad actors”, long enough for the afterglow images to fade. Observers can help in preventing persistence from affecting future observations with appropriate observing strategies, and, in cases where persistence cannot be avoided, by flagging possible bad actors with written comments in the phase II proposal and notifying the Contact Scientist or Program Coordinator.
While the screening process generally eliminates the worst cases of persistence, such as those in Figure 7.11, since the process is manual it is not perfect and so observers need to be aware of the possibility of persistence in their images. Indeed, in light of the fact that WFC3/IR exposures constitute a significant fraction of the overall HST observing program and in order to maintain HST scheduling efficiency, only a small fraction of the visits can be declared to be “bad actors”. This means that many IR images have some pixels that are affected by persistence. In the vast majority of cases, the number of pixels that are affected by persistence due to exposures from earlier visits is small compared to the number of pixels that should be flagged for other reasons. The tools and procedures needed to identify pixels affected by persistence and to mitigate its affect are described in the WFC3 Data Handbook. Observers are advised to take advantage of these tools to check whether the ability to extract science from their data has been adversely affected by persistence. Unlike in the event of a guidestar failure/loss of lock, significant persistence in a visit does not trigger an automated notification to the observers. It is the responsibility of observers to check their data in a timely manner, and request a repeat of a visit that has been compromised by persistence by filing a HOPR within the prescribed period.
While avoiding persistence created by other programs is outside of the control of an individual investigator, evaluating whether persistence within a visit will affect the quality of their data is the responsibility of the observer. Specifically, observers need to consider whether persistence within a single visit will affect their ability to extract science from their data. In carrying out this evaluation, note that fairly short exposures (100 sec) of relatively bright (18th mag) stars observed through the broad-band filters saturate pixels in the IR array and thus will generate self-persistence within visits. Furthermore, the amount of persistence decays inversely with time such that a pixel that has been saturated to an effective fluence of ~100,000 electrons will show an afterglow of about 0.3 electrons per sec at 1000 seconds, but ~2 electrons per sec at 200 seconds (Figure 5.31 in Section 5.7.7). Persistence at very short time scales is not as well characterized, although there are indications that persistence decays more slowly at first (WFC3 ISR 2019-02).
In most cases, persistence will not turn out to be a serious problem, particularly if the objects that have the potential to cause persistence are spatially separated from the area of the image from which science is obtained, and/or if the number of affected pixels is small, and/or if dither patterns are large. In these cases, the procedures described in the WFC3 Data Handbook should be sufficient to address any issues associated with internal persistence in the images.
However, in some cases, persistence will be an issue, for example if the science target is faint and the field is filled with considerably brighter objects. In these cases, one should avoid the tendency to set the exposure time for the faint science target thereby ignoring the problem that will be caused by the rest of the field. Observers should take care that bright or saturated sources within a field are not dithered across the same parts of the detector that record the highest science priority areas of the field.
Observations of dense fields, globular clusters, or very bright star formation regions may also be problematic e.g. in instances where precise photometry or very large dynamic range are required. On-orbit measurements of undithered exposures have shown that the flux rises across a sequence of exposures, affecting photometry at the level of 0.02-0.04 mag (WFC3 ISR 2016-11). This phenomenon, likely associated with persistence, is related to the slow rise in measured flux seen in grism observations of planetary transits (e.g. Wakeford et al., 2016, ApJ 819,10). Even in cases where data is dithered, persistence can affect photometric results if the steps are too small to avoid pixels previously illuminated; for this reason, step sizes of at least 10 pixels should be used when possible (WFC3 ISR 2019-07).
There are a variety of strategies one can adopt to minimize the effects of persistence. In many cases, the best approach is to take more shorter exposures to limit the numbers of pixels affected. In addition, executing dithers greater than 10 pixels, always to unique positions, substantially aids in persistence mitigation (WFC3 ISR 2019-07). This approach does, however, incur a greater cost in overheads, and becomes less effective as crowding increases. Taking shorter exposures or narrow band exposures before long or wide band exposures yields less fluence in previous exposures, thus leading to less persistence.
Various tools to estimate which regions of an image are likely to cause persistence and additional strategies to mitigate its effects are described in Appendix D.
Updates on persistence characterization and tools for persistence artifact removal will be posted on the WFC3 Persistence web page. |
7.9.5 The IR Background
In space, the dominant sources of background radiation are zodiacal light and earthshine at shorter IR wavelengths, and the telescope thermal emission at longer wavelengths. For HST, the sum of these two background components has a minimum at about 1600 nm (e.g., section 4.7 in the NICMOS Instrument Handbook). This wavelength lies near the red end of the reddest WFC3/IR filter, F160W (WFC3 H). A variable airglow line of He I at 10830 Å can be a significant, even dominant, component of the sky background in the F105W and F110W filters as well as the G102 and G141 grisms (WFC3 ISR 2014-03).
Figure 7.12 shows the observed background levels in the first few months of WFC3’s operation (green points and error bars), compared with values predicted from known instrument sensitivities and three levels of zodiacal light selectable in the Exposure Time Calculator (ETC). Even allowing for small sample sizes and possible systematics in the observations, it is apparent that a rough estimate of the zodiacal light level may not adequately predict the observed background level of an exposure. The WFC3 team has performed extensive studies of zodiacal light and earth-shine in WFC3/IR exposures as well as the He I airglow line to improve our understanding of the sky background, described in more detail below.
Figure 7.12: Infrared background levels for WFC3.
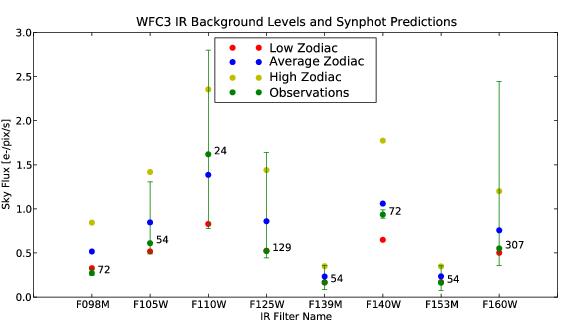
The average, low and high zodiac points show the synphot predictions for three levels of zodiacal light and no earth-shine. The observations selected include calibration and GO images of empty or sparsely populated fields, giving an accurate representation of early WFC3 observations but not covering all background conditions. Observational means (green points), ranges (error bars), and exposure counts are plotted.
The zodiacal background level observed in WFC3/IR exposures has been modeled as a function of ecliptic latitude and angular distance of the target from the sun (WFC3 ISR 2014-11). The dependence can be formulated as a function of ecliptic latitude and angular separation of the target from the sun in ecliptic longitude, or ecliptic latitude and the angle between the target and the sun as viewed by HST. The latter coordinate system has been adopted because it has practical advantages for planning and analyzing HST observations. The model derived for filter F160W is shown in Figure 7.13. The Sun Angle in the figure corresponds to the keyword SUNANGLE in the HST science image header. WFC3 ISR 2014-11 provides scaling factors to apply this model to other IR filters and the G141 grism, and shows that the model provides significantly better estimates of the zodiacal light than the model used by the ETC.
Figure 7.13: Zodiacal background level for filter F160W as a function of the target’s ecliptic latitude and angular distance from the sun.
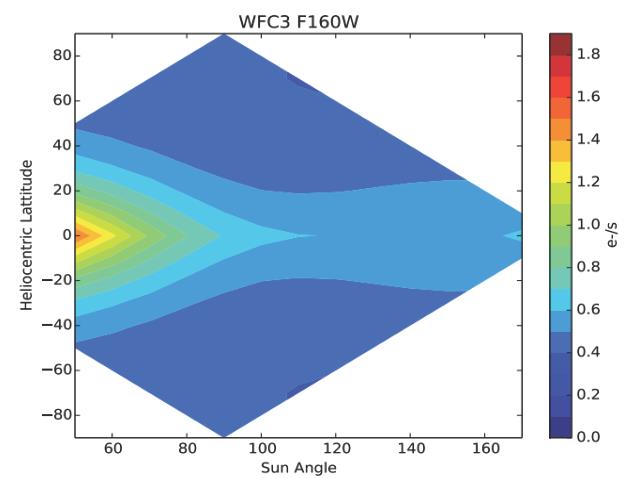
The highest levels of zodiacal light are avoided automatically by the HST observatory requirement that the Sun Angle be greater than 55°. For programs where a low background level is critical to the science goals, observers with a target at low ecliptic latitude may want to increase the solar avoidance angle from the default minimum of 55° to 60° or greater by excluding the range of dates when the target would be at the undesired angles, using Figure 7.13 as a guide. This can be implemented by applying BETWEEN statements to visits in the phase II proposal. The range of dates corresponding to the 55° exclusion rule can be displayed in the Visit Planner window in APT by clicking on the arrowhead that expands the schedulability plot for a visit into its components; Sun is the Sun Angle component. (Hold the cursor on a date range band to read the dates.) At low ecliptic latitudes, the Sun Angle of a target changes about 1° per day, so trimming 5 days from each end of the Sun schedulability date range increases the minimum Sun Angle to 60°. This approach provides many more opportunities for scheduling than the use of the LOW-SKY option (Section 9.7.1).
For pointings very close to the bright Earth limb, the zodiacal background may be exceeded by earth-shine. The brightness of the earth-shine falls very rapidly with increasing angle from the Earth’s limb thanks to the effectiveness of the HST baffles, and for most observations only a few minutes at the beginning and end of the target visibility period are significantly affected. Selective data reduction, i.e. excluding some readouts of the sample sequence in the affected exposures and recalibrating, can be a better option than accepting the shorter visibility period required by LOW-SKY (WFC3 ISR 2014-03 and Section 9.7.1). Targets observed in the continuous viewing zone (CVZ) will always be rather close to the Earth's limb, and so can sometimes contain an elevated background for a larger part of the orbit, even at shorter wavelengths where zodiacal emission ordinarily dominates. Observers have the possibility of specifying a non-standard Bright Earth Avoidance (BEA) angle, which increases the angle from the Earth's limb from 20° to 25°, but this comes at the cost of observing time and would not significantly improve most programs. Note that this is a special mode and must be requested through a Contact Scientist.
Investigation of unexpectedly high background levels in some early WFC3/IR imaging and spectroscopic exposures led to the identification of a He I airglow line at 10,830 Angstroms as the source (WFC3 ISR 2014-03). This line falls within the passbands of the F105W and F110W filters and both IR grisms. It is negligible in the Earth's shadow, generally strongest at low Earth limb angles outside the shadow, but sometimes strong even 40° above the Earth limb. In the worst cases, the airglow line is the dominant background emission. Examples of strongly affected exposures (with F105W, G102, G141) and unaffected exposures (with F125W, F160W) are illustrated in Figure 7.14.
Figure 7.14: Earth limb angle and background count rate for some of the spectral elements affected by He I airglow (F105W, G102, G141) and unaffected (F125W, F160W).
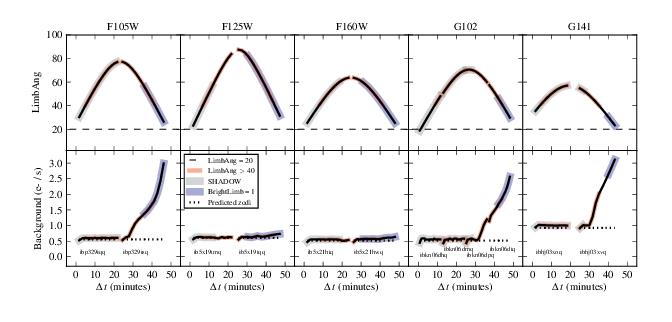
Top panels: Variation of Earth limb angle over the course of an orbit. The curves are colored following the labels in the legend.
Bottom panels: Variation of the background count rate throughout an orbit for specific filters and grisms. The predicted background level from the synphot/ETC zodiacal model is shown in the dotted line.
Where possible, observers should consider selecting alternative filters to F105W and F110W to avoid elevated background due to the He I airglow line. If other filters are used in the proposal, the observer should consider placing exposures unaffected by the airglow line at the beginning and end of an orbit and the exposures in that orbit should be placed in a non-interruptible exposure sequence, as described in the APT Training Materials. Use of the APT special requirement SHADOW to exclude the airglow line is not generally recommended due to the severe restrictions that it places on observing opportunities and orbit length (Section 9.7.2). The APT special requirement LOW-SKY may be helpful, but it also limits scheduling opportunities and orbit length (Section 9.7.1) and will not always exclude the airglow line, which can be bright at the permitted limb angles (>40°). Note that the use of special requirements must be justified in the Phase I submission.
Strategies for processing exposures with frames affected by strongly variable airglow are described in the WFC3 Data Handbook (as well as WFC3 ISR 2014-03 and WFC3 ISR 2016-16). If an flt image has an unexpectedly high background or excessive cosmic ray flagging, the observer should check the ima files for evidence of a variable background. The standard up-the-ramp fitting of the non-destructive reads in a WFC3/IR exposure does not work properly on images with a variable background since the variations are treated as cosmic rays. An improved flt image (at least for unsaturated sources) can be obtained by rerunning calwf3 with CRCORR=OMIT to turn off the ramp fitting and cosmic ray rejection. Cosmic rays can then be removed by using AstroDrizzle to combine sets of exposures. Alternatively, after running calwf3 without cosmic ray rejection, one can “flatten” the nonlinear ramps by subtracting the variable background of each read averaged over many pixels and adding back a constant for the overall average background count rate, then feed the flattened ima files back to calwf3 for the final step of identifying the cosmic rays. Scripts and examples are provided in the WFC3 Data Handbook and the HST Software Library.
There is noticeable diversity in the background of G102 and G141 exposures due to the varying contributions of zodiacal light and the He I airglow line. Because these contributions are spectrally distinct, the background can best be modeled using a combination of these components (WFC3 ISR 2020-04, WFC3 ISR 2015-17). See Section 8.5 for a discussion of this technique in the processing of WFC3/IR grism spectra.
7.9.6 Blobs
Image blemishes specific to the WFC3/IR detector have been described in Section 5.7.7. Other spots of reduced sensitivity in IR images, dubbed "blobs", are caused by reduced reflectivity of the Channel Select Mechanism mirror (which directs the incoming light beam into the IR channel). The blobs typically have a measured half-light radius of 10-15 pixels and absorb up to 15% of the incoming light at their centers.
Blobs were first noticed in IR images shortly after WFC3 was installed on HST. Their characteristics and the history of their occurrence are described in detail (WFC3 ISR 2010-06, WFC3 ISR 2012-15, WFC3 ISR 2014-21, and WFC3 ISR 2018-06). Pixels affected by blobs were initially identified in a single bad pixel table (BPIXTAB) that was designed to be applied to data taken after June 13, 2010 (WFC3 ISR 2012-10). This table has been superseded by a series of date-dependent bad pixel tables that track the appearance of “strong” and “medium” blobs (WFC3 ISR 2014-21, WFC3 ISR 2018-06). Figure 7.15 shows the location of blobs on the detector as of October 2025, which are included in current calibration pipeline bad pixel tables.
Corrections as large as 0.1 mag have been found for blob-impacted stars in Omega Centauri, and the accuracy of the corrected photometry is comparable to the photometric accuracy for stars in blob-free regions (WFC3 ISR 2015-06). Nevertheless, most observations will not be significantly affected by blobs, since blobs occupy only 2.25% of the detector area and their effects can be mitigated by dithering and drizzling. Appropriate dither strategies to mitigate the effects of blobs and other artifacts in IR images are described in WFC3 ISR 2010-09. See Section C.2 for the specifications of the WFC3-IR-DITHER-BLOB pattern implemented in APT.
Recent delta flat field reference files now include epoch-dependent corrections for blobs for six filters (F098M, F105W, F110W, F125W, F140W, and F160W; WFC3 ISR 2021-01; Section 5.7.4). Early versions of “blob flat fields”, to improve stellar photometry in crowded fields, were made in 2015 (described in WFC3 ISR 2014-21, available via the WFC3 IR flats webpage).
Figure 7.15: As of October 2025, there are 153 blobs on the WFC3/IR detector, which are identified by circles in the image below. They are color-coded according to their strength: very weak (cyan), weak (blue), moderate (green), and strong (red). Strong and moderate blobs (red and green respectively) are flagged in the BPIXTAB reference file.

7.9.7 Optical Anomalies
Anomalous features can be found in some WFC3/IR detector images due to a number of causes. For example, the optical system may cause stray light from sources outside the detector FOV to be scattered into images. Scattered earthlight can greatly increase the background on part of the detector when HST is pointing near the bright earth limb (see the WFC3 Data Handbook). Additional detector anomalies, ghosts, and defects are detailed on the WFC3 Anomalies webpage for both the UVIS and IR detectors. Also available on the same webpage is a downloadable database of all known anomalies in all non-proprietary WFC3 data, as maintained by the daily monitoring of the WFC3 Quicklook Team (WFC3 ISR 2017-02, WFC3 ISR 2020-02).
-
WFC3 Instrument Handbook
- • Acknowledgments
- Chapter 1: Introduction to WFC3
- Chapter 2: WFC3 Instrument Description
- Chapter 3: Choosing the Optimum HST Instrument
- Chapter 4: Designing a Phase I WFC3 Proposal
- Chapter 5: WFC3 Detector Characteristics and Performance
-
Chapter 6: UVIS Imaging with WFC3
- • 6.1 WFC3 UVIS Imaging
- • 6.2 Specifying a UVIS Observation
- • 6.3 UVIS Channel Characteristics
- • 6.4 UVIS Field Geometry
- • 6.5 UVIS Spectral Elements
- • 6.6 UVIS Optical Performance
- • 6.7 UVIS Exposure and Readout
- • 6.8 UVIS Sensitivity
- • 6.9 Charge Transfer Efficiency
- • 6.10 Other Considerations for UVIS Imaging
- • 6.11 UVIS Observing Strategies
- Chapter 7: IR Imaging with WFC3
- Chapter 8: Slitless Spectroscopy with WFC3
-
Chapter 9: WFC3 Exposure-Time Calculation
- • 9.1 Overview
- • 9.2 The WFC3 Exposure Time Calculator - ETC
- • 9.3 Calculating Sensitivities from Tabulated Data
- • 9.4 Count Rates: Imaging
- • 9.5 Count Rates: Slitless Spectroscopy
- • 9.6 Estimating Exposure Times
- • 9.7 Sky Background
- • 9.8 Interstellar Extinction
- • 9.9 Exposure-Time Calculation Examples
- Chapter 10: Overheads and Orbit Time Determinations
-
Appendix A: WFC3 Filter Throughputs
- • A.1 Introduction
-
A.2 Throughputs and Signal-to-Noise Ratio Data
- • UVIS F200LP
- • UVIS F218W
- • UVIS F225W
- • UVIS F275W
- • UVIS F280N
- • UVIS F300X
- • UVIS F336W
- • UVIS F343N
- • UVIS F350LP
- • UVIS F373N
- • UVIS F390M
- • UVIS F390W
- • UVIS F395N
- • UVIS F410M
- • UVIS F438W
- • UVIS F467M
- • UVIS F469N
- • UVIS F475W
- • UVIS F475X
- • UVIS F487N
- • UVIS F502N
- • UVIS F547M
- • UVIS F555W
- • UVIS F600LP
- • UVIS F606W
- • UVIS F621M
- • UVIS F625W
- • UVIS F631N
- • UVIS F645N
- • UVIS F656N
- • UVIS F657N
- • UVIS F658N
- • UVIS F665N
- • UVIS F673N
- • UVIS F680N
- • UVIS F689M
- • UVIS F763M
- • UVIS F775W
- • UVIS F814W
- • UVIS F845M
- • UVIS F850LP
- • UVIS F953N
- • UVIS FQ232N
- • UVIS FQ243N
- • UVIS FQ378N
- • UVIS FQ387N
- • UVIS FQ422M
- • UVIS FQ436N
- • UVIS FQ437N
- • UVIS FQ492N
- • UVIS FQ508N
- • UVIS FQ575N
- • UVIS FQ619N
- • UVIS FQ634N
- • UVIS FQ672N
- • UVIS FQ674N
- • UVIS FQ727N
- • UVIS FQ750N
- • UVIS FQ889N
- • UVIS FQ906N
- • UVIS FQ924N
- • UVIS FQ937N
- • IR F098M
- • IR F105W
- • IR F110W
- • IR F125W
- • IR F126N
- • IR F127M
- • IR F128N
- • IR F130N
- • IR F132N
- • IR F139M
- • IR F140W
- • IR F153M
- • IR F160W
- • IR F164N
- • IR F167N
- Appendix B: Geometric Distortion
- Appendix C: Dithering and Mosaicking
- Appendix D: Bright-Object Constraints and Image Persistence
-
Appendix E: Reduction and Calibration of WFC3 Data
- • E.1 Overview
- • E.2 The STScI Reduction and Calibration Pipeline
- • E.3 The SMOV Calibration Plan
- • E.4 The Cycle 17 Calibration Plan
- • E.5 The Cycle 18 Calibration Plan
- • E.6 The Cycle 19 Calibration Plan
- • E.7 The Cycle 20 Calibration Plan
- • E.8 The Cycle 21 Calibration Plan
- • E.9 The Cycle 22 Calibration Plan
- • E.10 The Cycle 23 Calibration Plan
- • E.11 The Cycle 24 Calibration Plan
- • E.12 The Cycle 25 Calibration Plan
- • E.13 The Cycle 26 Calibration Plan
- • E.14 The Cycle 27 Calibration Plan
- • E.15 The Cycle 28 Calibration Plan
- • E.16 The Cycle 29 Calibration Plan
- • E.17 The Cycle 30 Calibration Plan
- • E.18 The Cycle 31 Calibration Plan
- • E.19 The Cycle 32 Calibration Plan
- • E.20 The Cycle 33 Calibration Plan
- • Glossary