8.2 Slitless Spectroscopy with the UVIS G280 Grism
The G280 grism is a spare optic from WF/PC1. Figure 8.1 shows a spectrum of the wavelength calibration star WR14 observed as part of the Cycle 17 calibration program 11935. The circled spot shows the location of a direct image of the source obtained with a separate (undispersed) F300X filter exposure, but superposed on the grism image for illustrative purposes only. The prominent star-like feature near the center of the picture is the zeroth-order grism image, and the positive and negative higher orders extend towards the left and right of the zeroth order, respectively. The +1st order is defined to be the order with the higher throughput (due to the grating blaze), even though it falls at lower x-pixels than the position of the zeroth order. The +1st order extends to the left of the zeroth order a distance of about 1/4 of the image size. Further left there is heavy overlap with higher orders. Some prominent emission lines can be seen along the spectral trace.
Figure 8.1: Appearance of the G280 spectral orders on the detector. The circled source is the position of the direct image formed by summing an F300X image with the grism image. The stronger 1st order is to the left and the 0th order is in the center. Above the 1st orders, much weaker 2nd and 3rd orders are barely visible. The image shows the full extent of the detector in the x-axis (4096 pixels) and about 500 pixels in the y-axis.
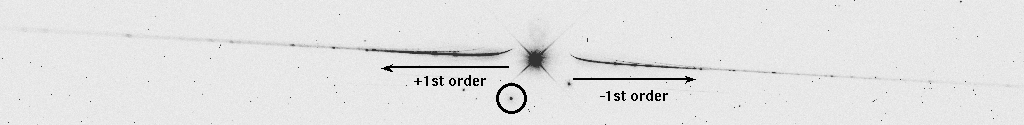
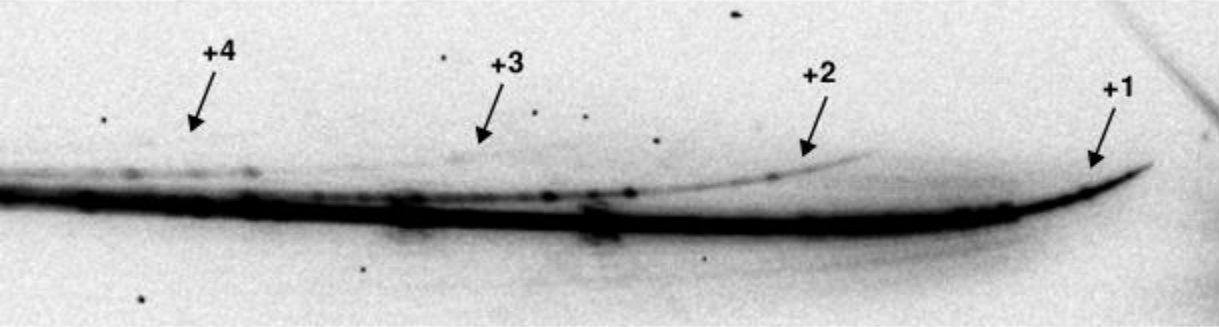
Figure 8.2: Close up view of the first few positive orders of the WR14 spectrum
The flux calibration of G280 spectra is best at the center of chip 2, and next best at the center of chip 1. Observers having a single target of interest are encouraged to place the target near the center of chip 2, due to the higher QE of chip 2 at very short wavelengths.
Field-dependent calibrations of the trace and dispersion for the -1 and +1 orders over the entire UVIS field of view are presented in WFC3 ISR 2017-20. The best fit to the shape of the G280 curved spectra on multiple locations on the detector was achieved using a 6th order trace polynomial with a linear 2D field dependence. The model reproduces the location of the curved traces of the +1 and -1 order spectra to within a fraction of a pixel. It fits a longer portion of the red part of each spectrum than the earlier ground calibration, and overall is a significant improvement over that calibration. The accuracy of the wavelength calibration is estimated to be ±7 Å, or about half of a UVIS resolution element.
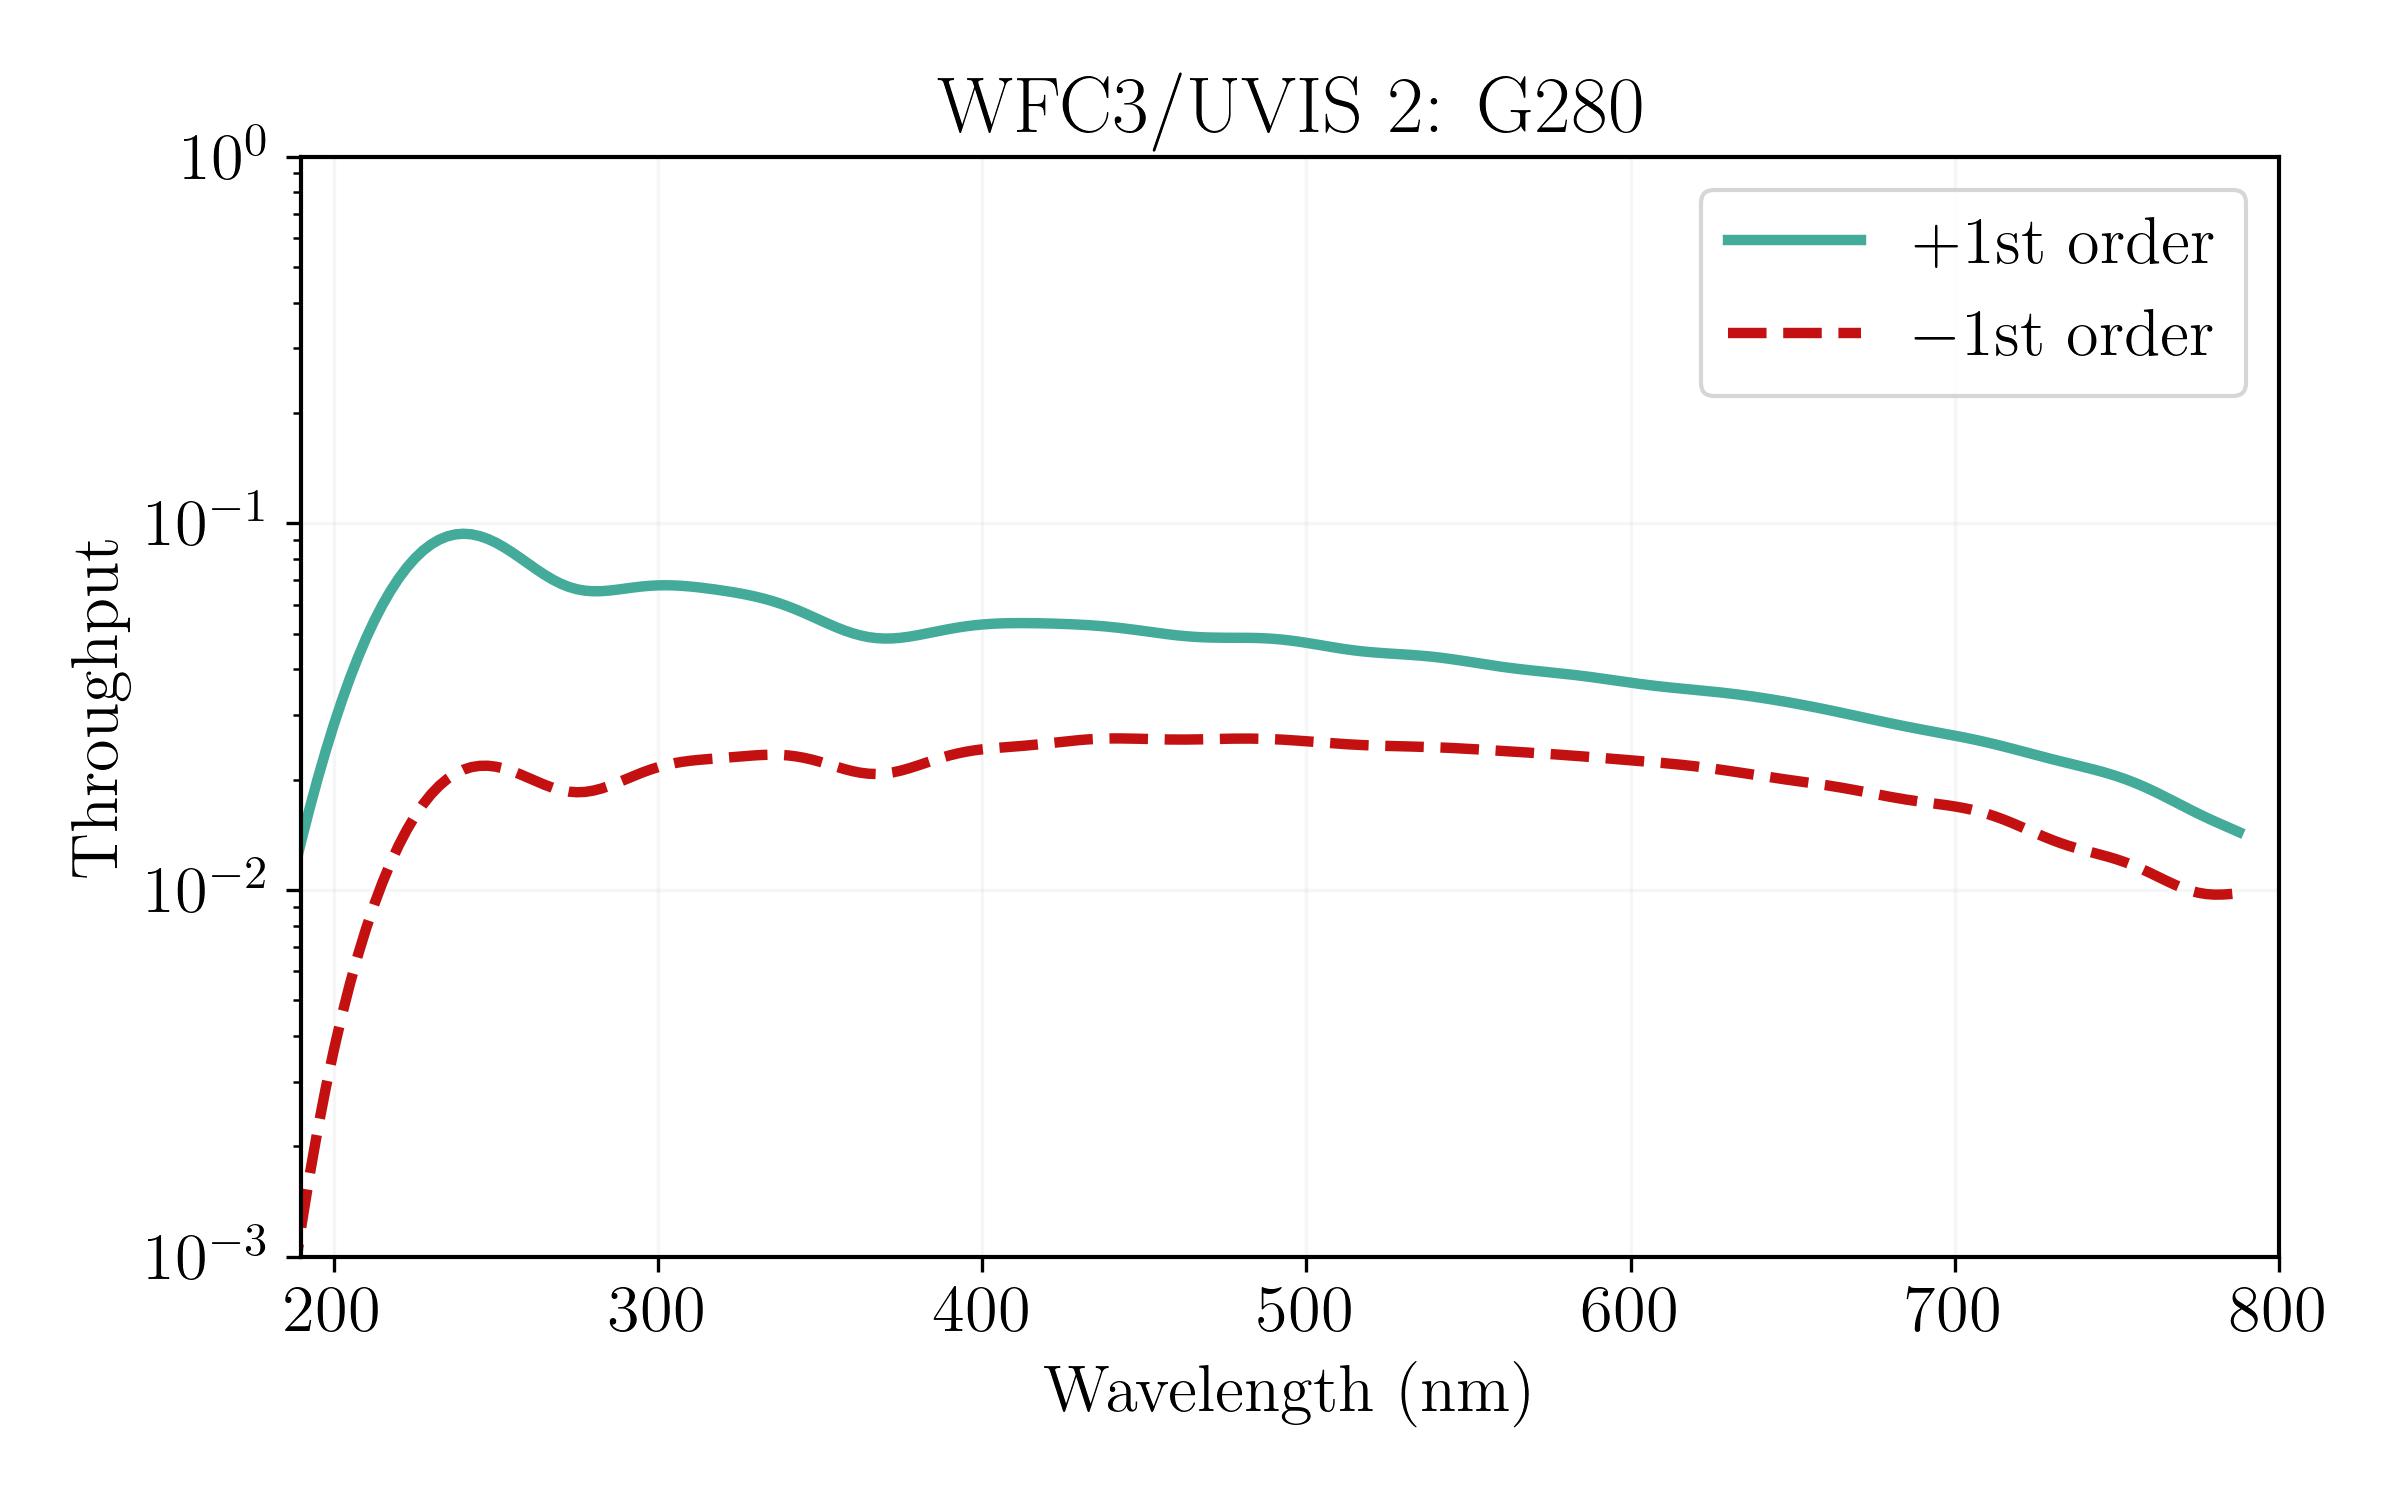
A full calibration of the WFC3 UVIS G280 slitless spectroscopic mode was performed in 2020 (see WFC3 ISR 2020-09). We combined all G280 calibration data through 2020 (nearly 600 datasets) to determine the traces, wavelength calibration, and flux calibration across the entire field of view of both UVIS detectors, modeling the large amount of field dependence of the G280 grism. This was done for the ±1, ±2, ±3, and ± 4 orders, and we have calibrated the position of the 0th order as well. Figure 8.3 shows the updated total 1st-order transmission for the WFC3 G280 mode.
The current absolute flux calibration of the G280 is estimated to be accurate to better than 10%. On deep exposures, orders out to at least -8 and +8 have been detected. Due to the relatively high throughput of the 2nd order, 1st order spectra longward of 400 nm are likely to be overlapped by 2nd order light longward of 200 nm, at least for sufficiently hot sources.
In 2023, the first background sky images for G280 were released (WFC3 ISR 2023-06). One set (two files, one for each CCD) were derived from individual flat-fielded (FLT) science exposures, while a second set were derived from their corresponding CTE-corrected (FLC) frames. Multiple parameters, such as the Earth limb angle, higher sun altitude, smaller sun angle, and the presence of zodiacal light, can increase the sky background for any given observation. However, it was found that all stray light scatters onto the CCD in a similar manner, so the background is well-modeled by a single component. While He I emission was detected in the WFC3/IR grisms (WFC3 ISR 2014-03), no emission line features have been detected in G280.
In 2025, a Jupyter notebook for processing exoplanet transits (WFC3 ISR 2025-01) was provided in the WFC3 notebook repository, which provides a tutorial to convert calibrated time series G280 data into light curves ready for analysis.
The Grism Resource page provides links to the most up to date software and calibration reference files. |
Figure 8.3: The throughput of the G280 grism as a function of wavelength for the positive and negative first order, using the most updated calibration reference files generated by the calibration presented in WFC3 ISR 2020-09.
Grism exposures of a given target field should always be accompanied by a direct image. The direct image provides source sizes and identifications, from which the corresponding locations of spectra in the grism images are determined. Knowledge of the direct-to-grism exposure source offsets is necessary to set the wavelength zero-point for each extracted spectrum and the source size measurements enable the software extraction slit to be tuned to each object (see Section 8.5). The 0th-order trace in G280 images is slightly dispersed (making it difficult to centroid) and often saturated (making it impossible to centroid), therefore it cannot be used in place of a direct image.
The natural choice of a direct-imaging filter to provide the reference image for G280 exposures is the F300X, because its response matches most closely the +1st-order grism response. The broader F200LP filter may be preferable for fainter objects. The shape of the spectra in G280 exposures varies significantly across the field of view but has been calibrated (WFC3 ISR 2020-09). The sensitivity of the +1 order also varies, but its field variation could not be handled by the aXe package and is only calibrated at the center of chip 2. The separate software package hstaxe, a Python follow-up to aXe, can now be used to extract and calibrate one-dimensional spectra from WFC3 grism exposures. Jupyter cookbooks illustrating the procedures for full- and subarray-frames of G280 data are available in the WFC3 section of the hstaxe Github repository. Small dithers of G280 exposures and accompanying direct image exposures are recommended to remove the effects of bad pixels. In addition, it is recommended that CR_SPLIT be used in both the direct and dispersed exposures to allow for cosmic-ray identification and removal.
G280 exposures can only be obtained using the “UVIS” aperture selection, which places the target at the reference point of the UVIS field of view, about 10" above the inter-chip gap, i.e. on chip 1. Accompanying direct images should use the G280-REF aperture selection, which places the target at the same location as in the dispersed exposures. If your observations are of a single primary target, it is best to specify a POS TARG Y of -50", for both the dispersed and direct exposures, to place the target at the center of chip 2, where the spectral calibrations are best determined and the near-UV sensitivity is somewhat higher than on chip 1.
For sufficiently bright objects, the multiple spectral orders may extend across the full field of view of the camera. This leads to overlapping of fainter spectra in the vicinity of the bright-object spectrum. Therefore, a careful determination of the optimum telescope roll angle is required to obtain non-overlapped spectra of faint objects in the vicinity of much brighter objects. i.e., the observer needs to set the orientation of the detector on the sky by using the Visit Orientation Requirements parameter “ORIENT” in the phase II proposal; e.g. ORIENT = 135.17 degrees aligns the Y axis of the UVIS detector with North for the G280 and G280-REF apertures. See Section 6.2. of the Phase II Proposal Instructions, which gives detailed information on the relationship between detector coordinates, spacecraft coordinates, and ORIENT. Note: if ORIENTs are necessary, they must be requested in the Phase I proposal.
CTE losses can be large for faint spectra on faint backgrounds. They should be taken into account when planning UVIS exposures. See Sections 5.4.11 and 6.9 for information on CTE and observing strategies.
-
WFC3 Instrument Handbook
- • Acknowledgments
- Chapter 1: Introduction to WFC3
- Chapter 2: WFC3 Instrument Description
- Chapter 3: Choosing the Optimum HST Instrument
- Chapter 4: Designing a Phase I WFC3 Proposal
- Chapter 5: WFC3 Detector Characteristics and Performance
-
Chapter 6: UVIS Imaging with WFC3
- • 6.1 WFC3 UVIS Imaging
- • 6.2 Specifying a UVIS Observation
- • 6.3 UVIS Channel Characteristics
- • 6.4 UVIS Field Geometry
- • 6.5 UVIS Spectral Elements
- • 6.6 UVIS Optical Performance
- • 6.7 UVIS Exposure and Readout
- • 6.8 UVIS Sensitivity
- • 6.9 Charge Transfer Efficiency
- • 6.10 Other Considerations for UVIS Imaging
- • 6.11 UVIS Observing Strategies
- Chapter 7: IR Imaging with WFC3
- Chapter 8: Slitless Spectroscopy with WFC3
-
Chapter 9: WFC3 Exposure-Time Calculation
- • 9.1 Overview
- • 9.2 The WFC3 Exposure Time Calculator - ETC
- • 9.3 Calculating Sensitivities from Tabulated Data
- • 9.4 Count Rates: Imaging
- • 9.5 Count Rates: Slitless Spectroscopy
- • 9.6 Estimating Exposure Times
- • 9.7 Sky Background
- • 9.8 Interstellar Extinction
- • 9.9 Exposure-Time Calculation Examples
- Chapter 10: Overheads and Orbit Time Determinations
-
Appendix A: WFC3 Filter Throughputs
- • A.1 Introduction
-
A.2 Throughputs and Signal-to-Noise Ratio Data
- • UVIS F200LP
- • UVIS F218W
- • UVIS F225W
- • UVIS F275W
- • UVIS F280N
- • UVIS F300X
- • UVIS F336W
- • UVIS F343N
- • UVIS F350LP
- • UVIS F373N
- • UVIS F390M
- • UVIS F390W
- • UVIS F395N
- • UVIS F410M
- • UVIS F438W
- • UVIS F467M
- • UVIS F469N
- • UVIS F475W
- • UVIS F475X
- • UVIS F487N
- • UVIS F502N
- • UVIS F547M
- • UVIS F555W
- • UVIS F600LP
- • UVIS F606W
- • UVIS F621M
- • UVIS F625W
- • UVIS F631N
- • UVIS F645N
- • UVIS F656N
- • UVIS F657N
- • UVIS F658N
- • UVIS F665N
- • UVIS F673N
- • UVIS F680N
- • UVIS F689M
- • UVIS F763M
- • UVIS F775W
- • UVIS F814W
- • UVIS F845M
- • UVIS F850LP
- • UVIS F953N
- • UVIS FQ232N
- • UVIS FQ243N
- • UVIS FQ378N
- • UVIS FQ387N
- • UVIS FQ422M
- • UVIS FQ436N
- • UVIS FQ437N
- • UVIS FQ492N
- • UVIS FQ508N
- • UVIS FQ575N
- • UVIS FQ619N
- • UVIS FQ634N
- • UVIS FQ672N
- • UVIS FQ674N
- • UVIS FQ727N
- • UVIS FQ750N
- • UVIS FQ889N
- • UVIS FQ906N
- • UVIS FQ924N
- • UVIS FQ937N
- • IR F098M
- • IR F105W
- • IR F110W
- • IR F125W
- • IR F126N
- • IR F127M
- • IR F128N
- • IR F130N
- • IR F132N
- • IR F139M
- • IR F140W
- • IR F153M
- • IR F160W
- • IR F164N
- • IR F167N
- Appendix B: Geometric Distortion
- Appendix C: Dithering and Mosaicking
- Appendix D: Bright-Object Constraints and Image Persistence
-
Appendix E: Reduction and Calibration of WFC3 Data
- • E.1 Overview
- • E.2 The STScI Reduction and Calibration Pipeline
- • E.3 The SMOV Calibration Plan
- • E.4 The Cycle 17 Calibration Plan
- • E.5 The Cycle 18 Calibration Plan
- • E.6 The Cycle 19 Calibration Plan
- • E.7 The Cycle 20 Calibration Plan
- • E.8 The Cycle 21 Calibration Plan
- • E.9 The Cycle 22 Calibration Plan
- • E.10 The Cycle 23 Calibration Plan
- • E.11 The Cycle 24 Calibration Plan
- • E.12 The Cycle 25 Calibration Plan
- • E.13 The Cycle 26 Calibration Plan
- • E.14 The Cycle 27 Calibration Plan
- • E.15 The Cycle 28 Calibration Plan
- • E.16 The Cycle 29 Calibration Plan
- • E.17 The Cycle 30 Calibration Plan
- • E.18 The Cycle 31 Calibration Plan
- • E.19 The Cycle 32 Calibration Plan
- • E.20 The Cycle 33 Calibration Plan
- • Glossary