5.7 IR Detector Characteristics and Performance
5.7.1 Quantum Efficiency
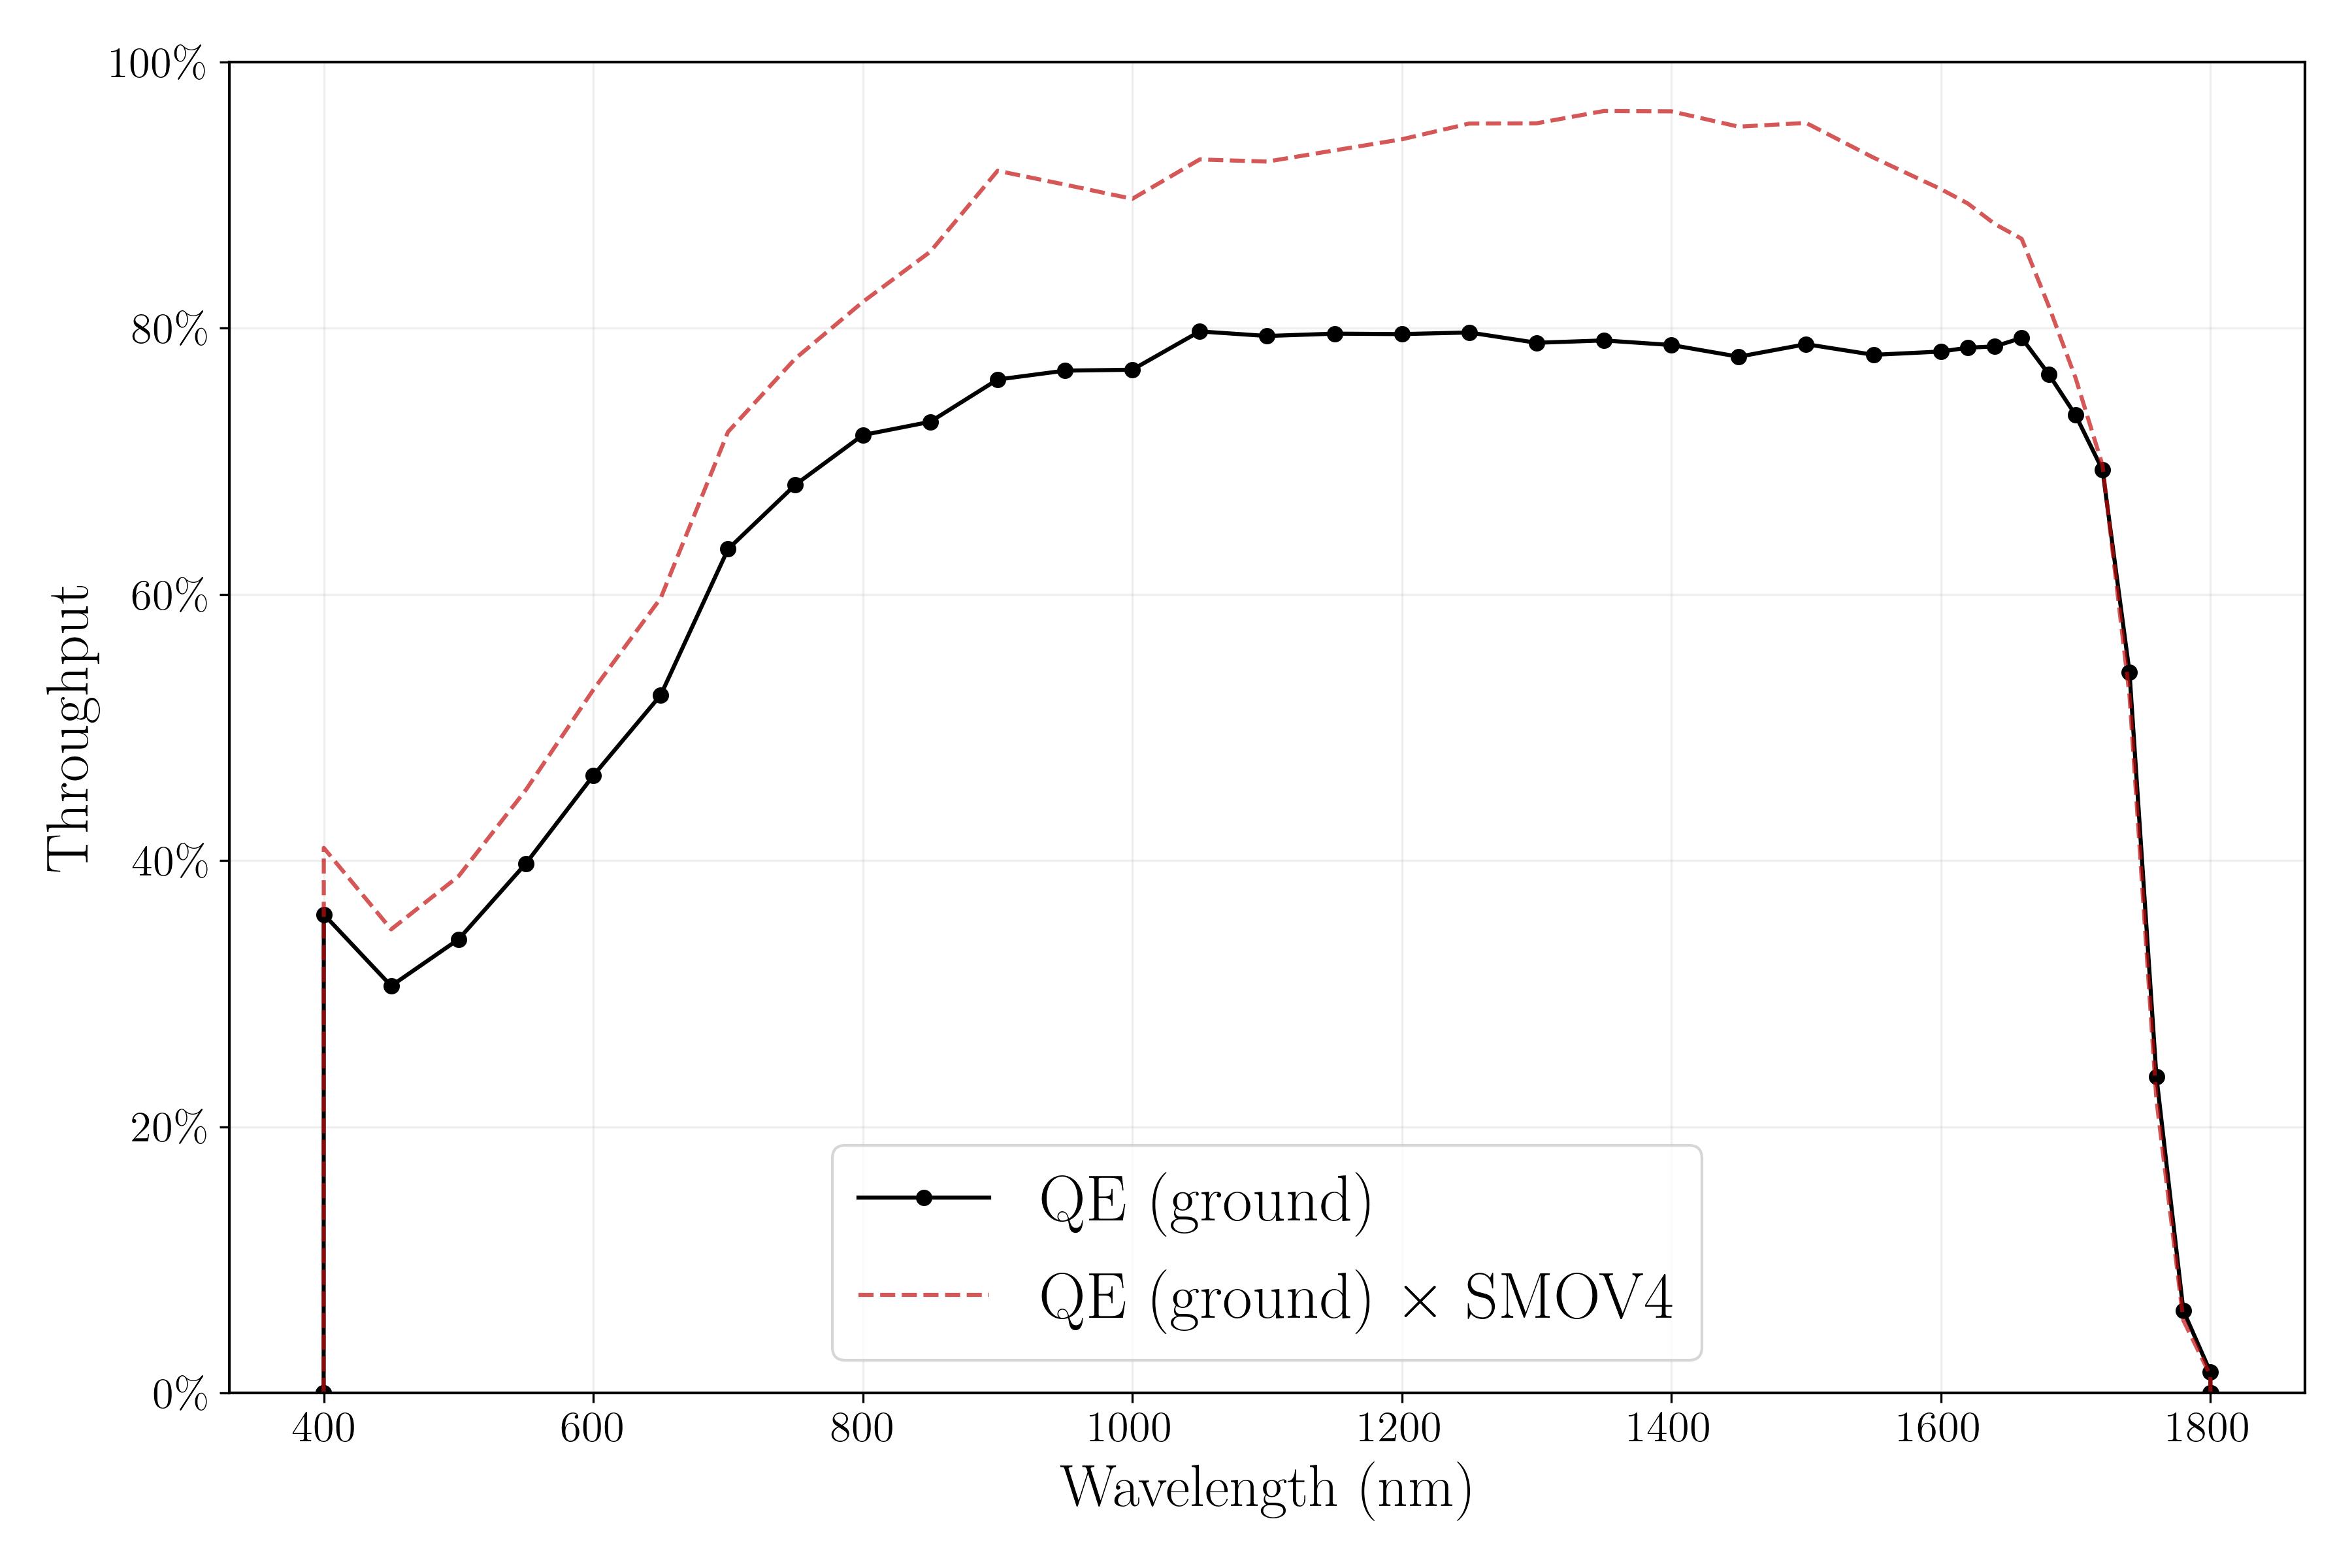
The quantum efficiency (QE) of the flight IR detector, as measured at the Goddard Detector Characterization Lab (DCL), is shown as a solid curve in Figure 5.25. The actual total system throughput of WFC3 depends on many factors including the HST OTA, pick off mirror, filter transmission functions, QE, etc. Based on ground measurements of these quantities, the total system throughput was calculated and compared to the first on-orbit measurements. A 5–20% increase in the total system throughput was discovered, attributed to multiple factors. The dashed curve represents the QE under the assumption that the entire flight correction is in the QE. Though this is admittedly unphysical given the realities of anti-reflection coatings and interpixel capacitance, computed total system throughputs are correct when the QE file is used in conjunction with the other optical components (pick off mirror, OTA, IR channel optics, and filters).
Figure 5.25: QE curve of the WFC3/IR detector from ground-based Goddard DCL measurements (solid). The total system throughput of the IR detector was measured on-orbit in SMOV4 (2009) to be higher than ground tests. The dashed curve shows the in-flight system throughput under the assumption that the entire observed gain is due to the QE. In reality, some fraction of this gain must reside in other HST and/or instrument components. This plot has been updated to use the latest version of the SMOV4 in-flight QE correction.
5.7.2 Dark Current
To avoid the complexity and limited lifetime of a stored-cryogen system, while at the same time providing the low operating temperatures required for dark-current and thermal-background reduction, the WFC3/IR detector is refrigerated with a six-stage TEC to a nominal operating temperature of 145 K. This is an unusually high operating temperature for near-IR detectors, and required tailoring the composition of the HgCdTe material for a long-wavelength cutoff at ~1700 nm. The higher band-gap associated with the short cutoff wavelength effectively limits both the intrinsic detector dark current and its sensitivity to the internal thermal background.
Direct thermal control of the detector (via a sensor integrated in the MUX that controls the 6-stage TEC current) provides typical thermal stability of < 50 mK. Tests made on similar detectors indicate that the residual dark-current variations can be largely calibrated and subtracted out using reference pixels.
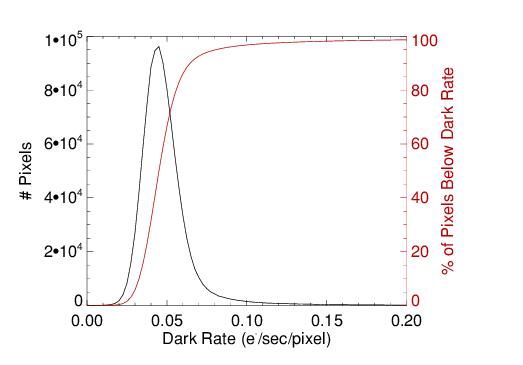
WFC3/IR exposures taken with an aluminum blank in place, rather than a filter, provide a measure of the detector dark current. The dark current of the flight array has a skewed distribution, with a mode, median, and mean of 0.045, 0.048, and 0.048 e–/s/pixel respectively. The shifted mode is due to the asymmetry of the dark-current distribution among the pixels, characterized by a long tail of “hot pixels” randomly located across the detector. While the mean underlying dark current has been stable on-orbit (WFC3 ISR 2017-04; WFC3 ISR 2012-11), a small number of pixels (<4%) vary over time and are corrected in the calibration pipeline via time-dependent superdarks (WFC3 ISR 2019-04).
The histogram of dark current values, along with the cumulative dark-current distribution, i.e., the fraction of pixels with a dark current lower than a certain level, is shown in Figure 5.26; WFC3 ISR 2009-21 provides details on dark current calculations. Improved superdark reference files were created for all allowed full-frame and subarray modes using data collected during 2009-2013 (WFC3 ISR 2014-06). The signal-to-noise improved by a factor of 3-11 due to the use of a great deal more data, the use of a non-linearity correction, and the use of persistence masks. In 2019, updated WFC3/IR dark calibration files were created for all allowed observing modes. Time-dependent pixels in these superdarks were generated in a Cycle-by-Cycle basis, allowing for improved calibration of those ∼3.5% of detector pixels that have changed their dark current behavior since launch (WFC3 ISR 2019-04).
Note that in broad filters, the dominant background is not the dark current but zodiacal light, which at 0.3-1.0 e–/s/pixel is a factor of 10-20 times larger than the dark. The WFC3 ETC can be used to compute the zodiacal light contribution for a given pointing, in addition to providing thermal and dark current estimates (Sections 7.9.5 and 9.7).
Figure 5.26: Histogram of the WFC3/IR detector dark current.
5.7.3 Read Noise
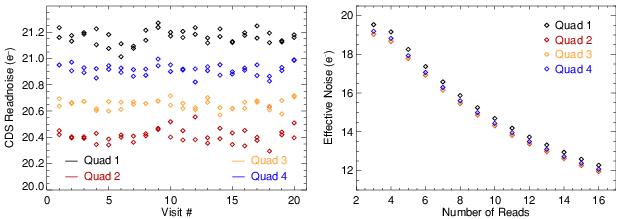
The IR detector has four independent readout amplifiers, each of which reads a 512 × 512 pixel quadrant. The four amplifiers generate very similar amounts of read noise. This is illustrated in Figure 5.27, which compares the correlated double sampling (CDS) read noise levels for the four quadrants of the detector. CDS read noise refers to the noise associated with subtracting a single pair of reads. These read noise values were derived from a series of RAPID ramps taken during SMOV testing, providing a measure of the total noise in a difference image. For short ramps, such as these RAPID ramps, the contribution of shot noise due to dark current accumulation is less than 0.01 e– and the CDS read noise of the detector is between 20.2–21.4 e– (left plot in Figure 5.27). By averaging over multiple reads, the effective noise of an IR ramp can be significantly reduced. As Figure 5.27 (below, right plot) illustrates, the effective noise in a SPARS200 ramp drops from ~20.0 e– down to ~12.0 e– (based on 2 reads plus zeroth read and 15 reads plus zeroth read, respectively). Similar reductions in noise can be achieved with other sample sequences (WFC3 ISR 2009-23).
Figure 5.27: Correlated double-sampling read noise values measured for each quadrant in forty RAPID ramps during early on-orbit SMOV testing in 2009 (left plot). The effective noise in a SPARS200 ramp as a function of the average number of reads +1 (i.e., including the zeroth read) is shown in the right plot.
For some programs, read noise will not be an issue while for others, such as ultra-low-background observations, the read noise can be a non-negligible component of the noise floor. The relative contribution of read noise to the total noise will depend, of course, on infrared background levels as well (Section 7.9.5). The contribution to the read noise in WFC3/IR data due to digitization errors associated with the conversion from electrons to data numbers (DN) is negligible.
5.7.4 Flat Fields
Before launch, ground-based flats were obtained for the 15 imaging IR filters at a mean SNR of ~500 per pixel using an external optical stimulus (ISR 2008-28). Because the overall illumination pattern of the ground-based flats does not precisely match the illumination attained on-orbit from the OTA, there are errors in these ground-based flats on large spatial scales. These errors were initially measured by performing stellar photometry on rich stellar fields that were observed using large-scale dither patterns during SMOV and cycle 17 (ISR 2009-39). The errors were later determined more accurately by creating sky flats from thousands of on-orbit exposures, masking out astronomical sources and assuming filter-independent corrections. Initial flat field reference files corrected using these sky flats were delivered in December 2011 (ISR 2011-11).
These reference files were replaced in October 2020 with flats generated using a much larger set of in-flight data (ISR 2021-01). Six filters (F098M, F105W, F110W, F125W, F140W, and F160W) have sufficient signal-to-noise that the flats are now derived purely from in-flight data and are no longer dependent on the ground test data. For the remaining nine IR filters, the ground "P-flats" (pixel-to-pixel variation flats) were multiplied by a smooth correction derived from wavelength-interpolation using sensitivity residuals from the six primary filters. An accompanying set of delta flats (also known as "D-flats"; ISR 2021-10) was created for the six primary filters to correct for IR blobs at different epochs (Section 7.9.6). When two or more types of flats are available, they are multiplied together by calwf3 to form a combined flat field correction image.
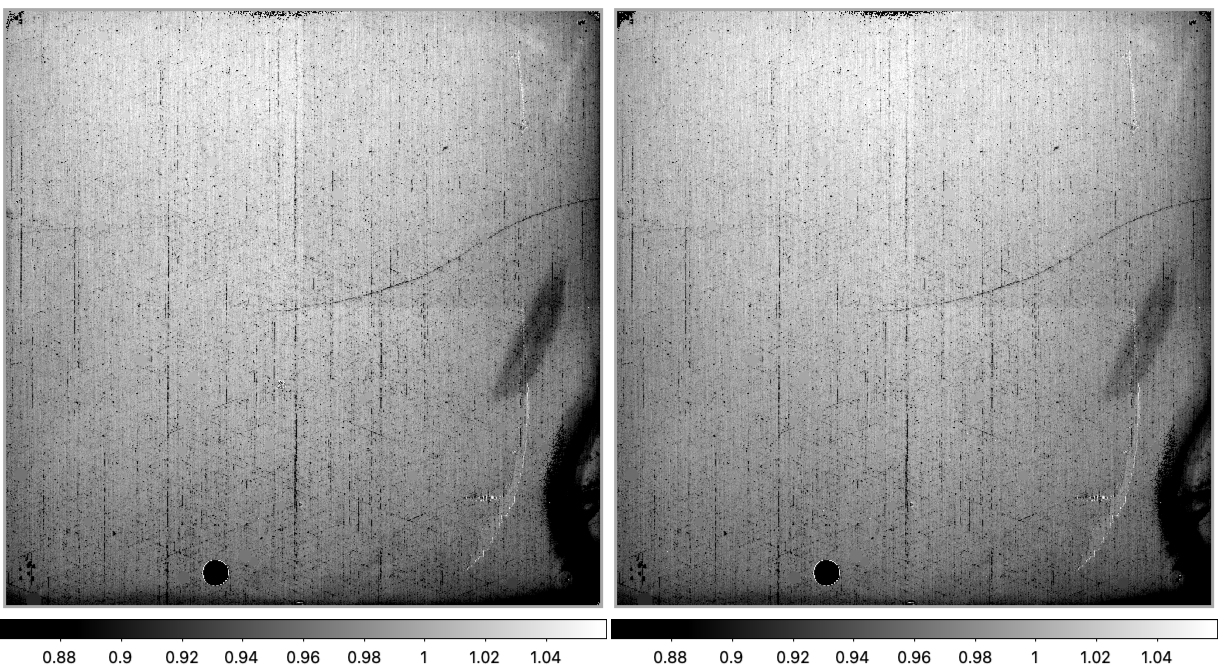
Figure 5.28 shows examples of bias-corrected P-flats computed from in-flight science observations acquired over ~10 years in the wide-band filters F110W (left) and F160W (right).
Figure 5.28: Updated WFC3/IR pixel-to-pixel flats for F110W (left, 4ac1921ri_pfl.fits) and F160W (right, 4ac1921li_pfl.fits).
| The latest information about IR flats can be found on the WFC3/IR Flats webpage. |
5.7.5 Linearity and Saturation
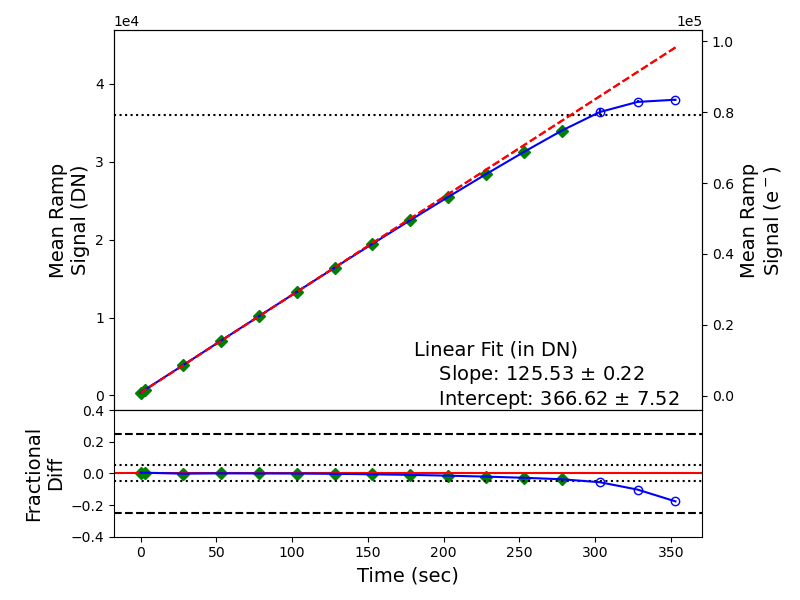
The WFC3/IR channel uses an HgCdTe detector which has an intrinsic non-linear response to incident photons. This is illustrated in Figure 5.29 which plots the observed signal for a sample detector pixel during a flat field ramp. The red line is a linear fit to the early reads at low signal levels, and the horizontal line indicates the pixel's saturation limit at ~78,000 electrons. The fractional difference between the measured data and a linear fit to the ideal signal is shown in the bottom panel, where dotted lines show the 5% non-linearity threshold used to define the saturation limit.
Non-linearity effects are corrected in the calwf3 pipeline with the NLINFILE reference file. Pixels below the saturation limit are modeled by a third order polynomial fit which relates the measured and the idealized signal for each pixel. For details, refer to the NLINCORR section of the calwf3 software documentation.
The non-linearity solution used for pipeline calibration between 2009 and 2025 was based a set of quadrant-averaged polynomials derived from Tungsten lamp flats acquired during ground testing (WFC3 ISR 2008-39). A new pixel-based non-linearity correction was delivered in October 2025 and has been used to recalibrate all WFC3/IR imaging and grism observations in the MAST archive. The new solution was derived using a large set of on-orbit flats (WFC3 ISR 2025-08) and tested using a variety of targets and observing modes including: star clusters, HST flux standards, and flat fields acquired in a range of sample sequences (WFC3 ISR 2025-09).
In general, the new correction improves the linearity for sources (pixels) reaching fluence levels of ~50,000 electrons and higher, with the largest effect for signal levels approaching the full well limit near ∼80,000 electrons. The new reference file also significantly decreases the number of false positive cosmic-rays flagged during calwf3's up-the-ramp fit (due to non-linearity errors), resulting in improved photometric accuracy and higher signal-to-noise in the new calibrated data products.
Figure 5.29: Top Panel: Non-linear response of the observed signal for a sample IR detector pixel measured from a flat field ramp. The red line is a linear fit to reads at low signal levels, extended to the end of the ramp. The horizontal line indicates a 5% deviation from linearity, used to define the saturation limit. (Saturated pixels are plotted as open symbols and not included in the polynomial fit). Bottom Panel: Fractional difference between the observed signal and the linear fit.
5.7.6 Count Rate Non-Linearity
Previous HgCdTe detectors on HST have suffered from a count-rate dependent non-linearity (CRNL) and the WFC3/IR detector is no exception. An initial measurement of this effect was made by comparing the photometry of star clusters observed over a wide dynamic range and at overlapping wavelengths in the WFC3/IR and NICMOS and/or ACS/WFC detectors. We found a CRNL of ~1% per dex over a range of 10 magnitudes (4 dex) which was independent of wavelength (WFC3 ISR 2010-07). This measurement was confirmed using exposures that boosted count rates with Earth limb light (WFC3 ISR 2010-15) and observations of groups of stars observed with 2MASS (WFC3 ISR 2011-15). The impact of count-rate non-linearity is that photometry of faint (i.e., sky dominated) sources calibrated with WFC3/IR zeropoints will appear 0.04 +/-0.01 mag too faint. The effect is an order of magnitude smaller than the effect found for NICMOS, but large enough to potentially limit the accuracy of photometry.
In 2019, more precise measurements of CRNL were made by using a combination of comparisons of cluster star photometry between WFC3/IR and WFC3/UVIS and by using observed and synthetic magnitudes of white dwarfs (WFC3 ISR 2019-01). In this study, the measured range of CRNL was also extended to higher count rates by comparing magnitudes between the ground and WFC3/IR for LMC and Milky Way Cepheids. Combining these results with all previous measurements and those from the WFC3 grism provides a consistent and improved characterization of the CRNL of WFC3/IR, of 0.75% +/- 0.06% per dex, with no apparent wavelength dependence, measured across 16 astronomical magnitudes. This result should be used to correct IR photometry by using the difference in apparent flux (in dex) between where the WFC3/IR zeropoint is set (~12th mag) and the target source. Fainter sources appear even fainter and thus must be corrected to be brighter.
5.7.7 Detector Cosmetics
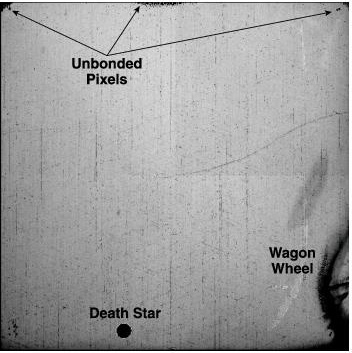
The WFC3/IR detector’s pixel population includes several flavors of anomalously responsive pixels: hot, cold, unstable, dead, and deviant in the zeroth read. Hot pixels, those showing excess charge, are defined as pixels with more than 100 times the average dark current. Cold pixels are inversely sensitive to incident photons and exhibit a negative slope when measured up the ramp (i.e., pixel value is lower in last frame up the ramp compared to first frame). The anomalous response of a cold pixel could be due to lower intrinsic QE in that pixel or to surface defects. Unstable pixels, as the name implies, are those that behave in an unpredictable fashion; that is, the signal up the ramp does not repeat reliably from ramp to ramp (Appendix 2, WFC3 ISR 2010-13 show examples). There are dead, or unbonded, pixels which do not respond to light (Figure 5.30). Overlapping the dead pixel population is the population of pixels that has bad zeroth read values, generally due to being short-circuited or unbonded (WFC3 ISR 2003-06).
In addition to randomly-distributed bad pixels, coherent regions of bad pixels exist in the IR detector (Figure 5.30). Pixels in the lower-right region (dubbed “wagon wheel”) have lower than normal quantum efficiency. There are dead pixels near the detector edge and in the circular “death star” feature near the bottom. Pixels with deviant zeroth read are concentrated in the areas of the death star, the upper corners of the detector, and the quadrant boundaries. (The death star region is marked in the WFC3 FOV in APT to aid in observation planning.) WFC3 ISR 2008-28 describes the characterization of these defects based on ground-testing data; WFC3 ISR 2010-13 describes the various types of populations of bad pixels as observed on-orbit.
Figure 5.30: IR Detector Cosmetic Defects
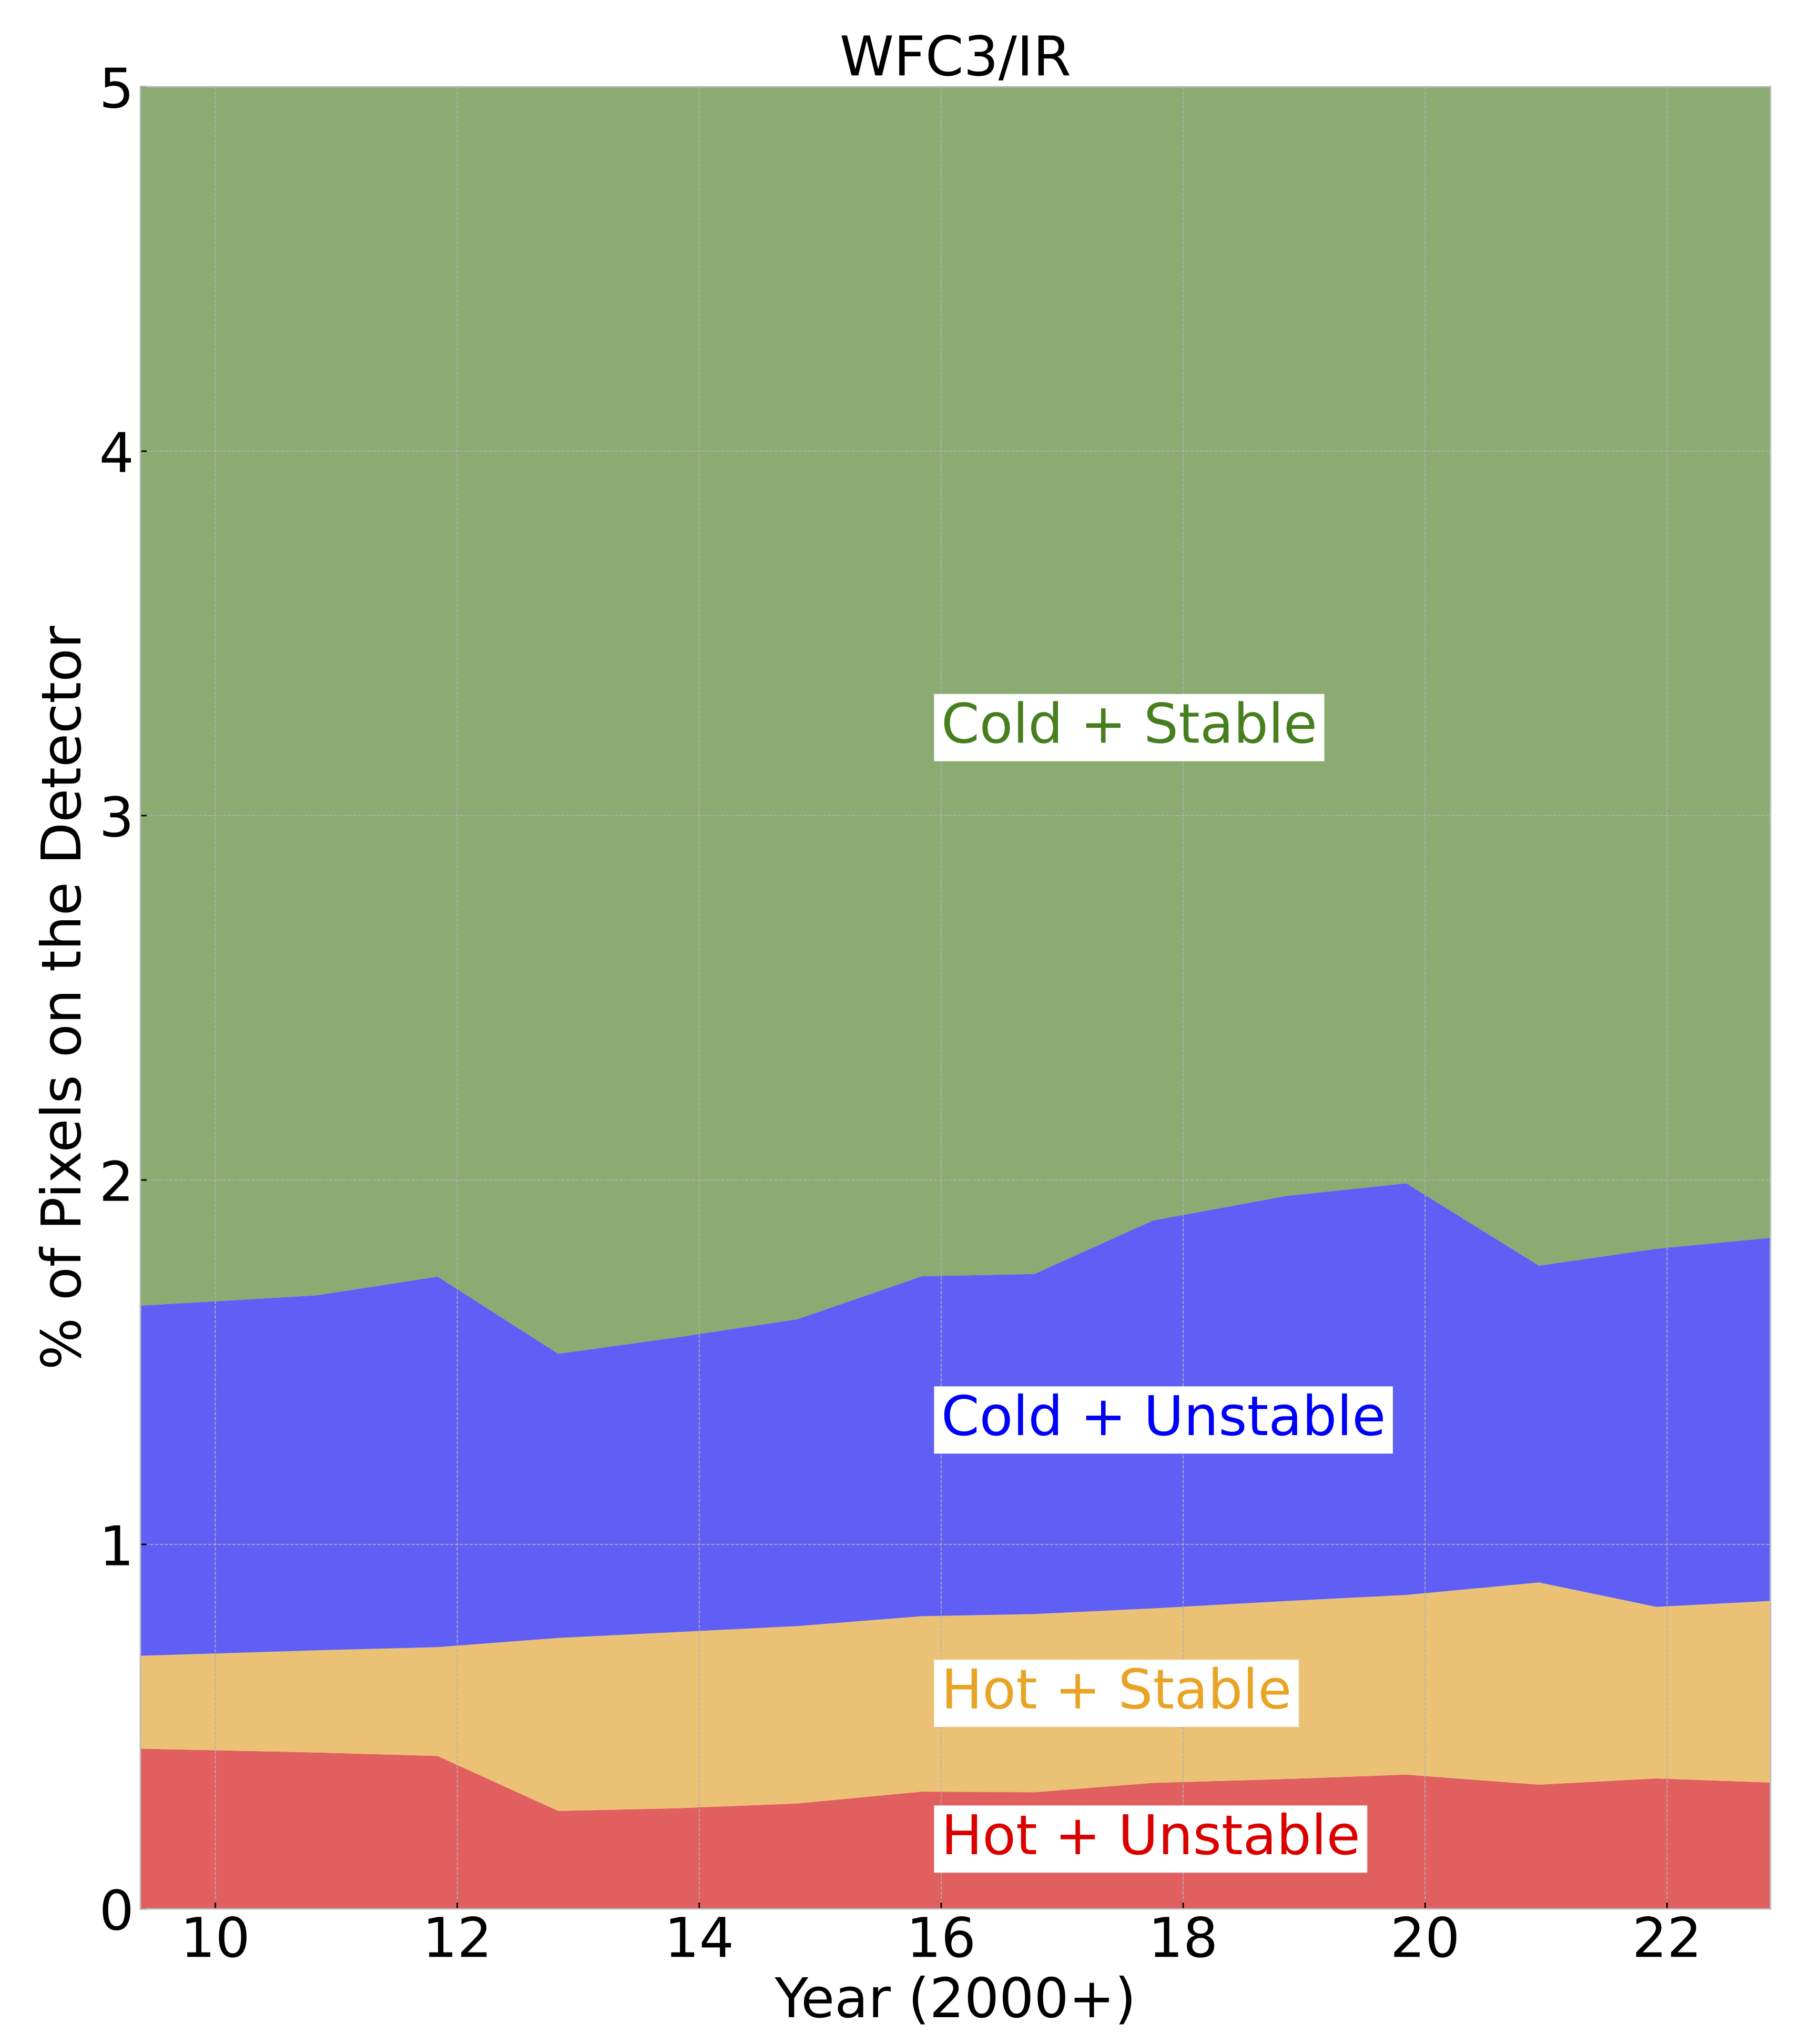
In general, the WFC3/IR detector shows an increase of only ~200 hot pixels per year (~0.02% of the detector). Prior to 2020, the unstable pixel population varied up to ~4000 pixels per year (~0.4% of the detector). It was observed that the unstable pixel population more than doubled between Cycle 27 and Cycle 28 (WFC3 ISR 2022-01), such that approximately ~3.35% detector pixels were classified as unstable (2.85% cold and 0.5% hot). However, WFC3 ISR 2024-02 found that this was due to algorithmic discrepancies in the pipeline used for generating the bad pixel table; subsequent analysis showed that the actual flagged pixel percentage was <1% for Cycle 28, and that IR bad pixel populations remained stable through Cycles 29 and 30.
Calibration reference files in the past were insensitive to periods of pixel stability, simply permanently flagging as bad any pixels which spent any amount of time in a hot and/or unstable state. Now, time-variable pixel behavior is captured in the bad pixel tables and superdarks with a data quality flag of 32 to mark unstable pixels (as is now done for UVIS as well); e.g. unstable hot pixels are flagged with both ‘32’ and ‘16’ (hot) (Table E.3). As a result, users can reclaim stable pixels – even when hot – for their analyses; doing so can recover about 0.5% of the detector, which otherwise would have been thrown out. Likewise, the WFC3/IR bad pixel tables now track the time-variable bad pixel populations, which ensures that new bad pixels are flagged in a timely fashion and that the thousands of pixels which revert to a stable configuration are not flagged and discarded (WFC3 ISR 2024-16, WFC3 ISR 2024-02, WFC3 ISR 2019-04).
Figure 5.31: Trends in the WFC3/IR pixel populations over time. The yellow area represents hot pixels that were found to be stable; while these are flagged as hot (DQ value 16) in observations, they are now successfully calibrated and do not necessarily need to be discarded from analyses. Pixels flagged as unstable (DQ value 32, blue and red areas) are not recommended for use.
5.7.8 Crosstalk
As is common in devices with multiple amplifiers being read out simultaneously, the IR channel exhibits crosstalk: a bright source in one quadrant causing electronic ghosting in another quadrant. In the IR, the crosstalk manifests itself as a very low-level negative mirror image. In WFC3, amplifiers 1 and 2 are coupled (upper left and lower left quadrants; Figure 5.23) and amplifiers 3 and 4 are coupled (lower right and upper right quadrants). That is, sources in quadrant 1 generate crosstalk in quadrant 2, sources in quadrant 2 generate crosstalk in quadrant 1, and so on.
The level of the IR crosstalk is only ~1e–06 that of the target flux (WFC3 ISR 2010-02); for unsaturated sources, the crosstalk is below the background noise. Once a source saturates, the crosstalk becomes visible at about the level of the background and remains constant as the voltage of the device is pinned.
5.7.9 Image Persistence
Image persistence is a common problem in HgCdTe and other types of IR arrays. Persistence manifests itself as ghost images or afterglows from earlier exposures. It was seen in NICMOS, and is also seen in a small but non-negligible fraction of the exposures taken with the Hawaii 1R detector that is the heart of the WFC3/IR channel.
Persistence is caused by traps that exist in the active regions of the reverse-biased diodes that make up the pixels of the detector. Resets, which occur at the end of multi-accum exposures (and during the process of flushing the detector when not observing with the IR channel), maximize the reverse bias of the diodes. Light impinging on the diode creates photo-electrons which cause the reverse bias to decrease. Changing voltages within the diode expose portions of the depletion region to free charge. Dislocations in these newly exposed regions trap charge. More traps are exposed for bright sources than for faint ones. This trapped charge is released in later exposures, resulting in after-images. The greater the saturation of the detector, the greater the number of traps and the greater the afterglow. Smith et al. 2008 (Proc. SPIE, 7021) has provided a very clear description of the physics of persistence and the effects in IR arrays.
The characteristics of persistence vary for different devices and device technologies, reflecting in part how traps are distributed within the diodes. Persistence in the WFC3 channel is primarily a function of the fluence (the total number of photo-electrons released) in an exposure, and secondarily a function of the amount of time the pixel is held at a high fluence level. As discussed by Long et al. 2012 (Proc. SPIE, 8442), the amount of persistence in the WFC3/IR detector is a non-linear function of the fluence. Persistence is observed mainly in situations where fluence levels approach or exceed saturation of the detector.
Several examples of persistence in WFC3 observations and strategies for avoiding persistence are described in Section 7.9.4. A description of a phenomenological model of persistence used to aid in removing the effects of persistence is given in Chapter 8 of the WFC3 Data Handbook.
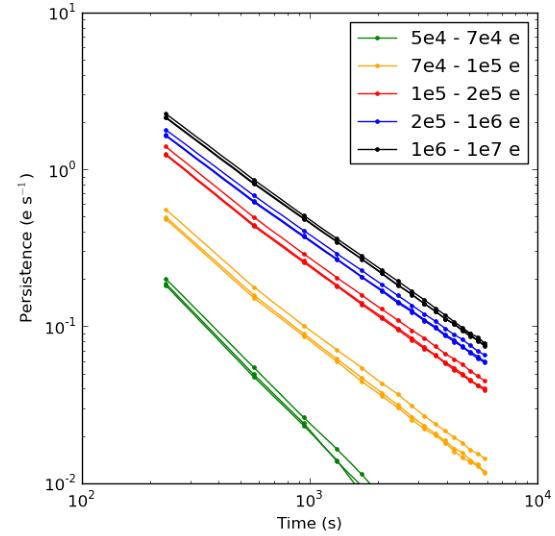
Figure 5.32 shows the characteristic shape of persistence versus fluence as observed in a series of darks following an image of Omega Centauri which had been deliberately exposed to a level where many stars in the image were saturated. The first dark exposure took place a few minutes after the end of the Omega Centauri exposure and the last dark exposure took place about one orbit (~96 minutes) later (WFC3 ISR 2013-07). The amount of persistence is fairly small until the exposure level reaches about half of full well and saturates near full well exposure. The persistence gradually decays with time from the first dark exposure (highest curve in figure) to the last dark exposure (lowest curve in figure).
Figure 5.32: Persistence as a function of fluence (“stimulus” provided by exposure to Omega Centauri) observed over the detector in a subsequent series of darks (color coded).
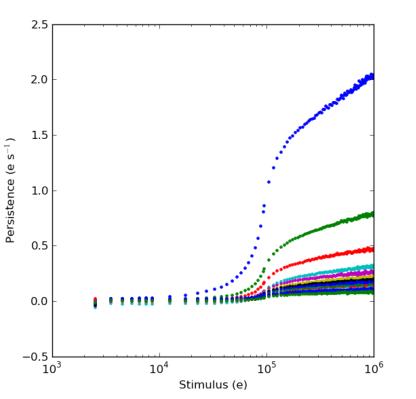
Figure 5.33: Persistence as a function of time for pixels with selected (color coded) levels of fluence provided by exposure to Omega Centauri.
MAST includes a search form that provides a persistence image for a specified exposure, produced by applying the persistence model to the preceding WFC3/IR exposures (see the WFC3 Data Handbook). Since the model is imperfect, the persistence image is intended as a guide to which pixels to flag in an exposure rather than as a reliable indicator of flux corrections.
-
WFC3 Instrument Handbook
- • Acknowledgments
- Chapter 1: Introduction to WFC3
- Chapter 2: WFC3 Instrument Description
- Chapter 3: Choosing the Optimum HST Instrument
- Chapter 4: Designing a Phase I WFC3 Proposal
- Chapter 5: WFC3 Detector Characteristics and Performance
-
Chapter 6: UVIS Imaging with WFC3
- • 6.1 WFC3 UVIS Imaging
- • 6.2 Specifying a UVIS Observation
- • 6.3 UVIS Channel Characteristics
- • 6.4 UVIS Field Geometry
- • 6.5 UVIS Spectral Elements
- • 6.6 UVIS Optical Performance
- • 6.7 UVIS Exposure and Readout
- • 6.8 UVIS Sensitivity
- • 6.9 Charge Transfer Efficiency
- • 6.10 Other Considerations for UVIS Imaging
- • 6.11 UVIS Observing Strategies
- Chapter 7: IR Imaging with WFC3
- Chapter 8: Slitless Spectroscopy with WFC3
-
Chapter 9: WFC3 Exposure-Time Calculation
- • 9.1 Overview
- • 9.2 The WFC3 Exposure Time Calculator - ETC
- • 9.3 Calculating Sensitivities from Tabulated Data
- • 9.4 Count Rates: Imaging
- • 9.5 Count Rates: Slitless Spectroscopy
- • 9.6 Estimating Exposure Times
- • 9.7 Sky Background
- • 9.8 Interstellar Extinction
- • 9.9 Exposure-Time Calculation Examples
- Chapter 10: Overheads and Orbit Time Determinations
-
Appendix A: WFC3 Filter Throughputs
- • A.1 Introduction
-
A.2 Throughputs and Signal-to-Noise Ratio Data
- • UVIS F200LP
- • UVIS F218W
- • UVIS F225W
- • UVIS F275W
- • UVIS F280N
- • UVIS F300X
- • UVIS F336W
- • UVIS F343N
- • UVIS F350LP
- • UVIS F373N
- • UVIS F390M
- • UVIS F390W
- • UVIS F395N
- • UVIS F410M
- • UVIS F438W
- • UVIS F467M
- • UVIS F469N
- • UVIS F475W
- • UVIS F475X
- • UVIS F487N
- • UVIS F502N
- • UVIS F547M
- • UVIS F555W
- • UVIS F600LP
- • UVIS F606W
- • UVIS F621M
- • UVIS F625W
- • UVIS F631N
- • UVIS F645N
- • UVIS F656N
- • UVIS F657N
- • UVIS F658N
- • UVIS F665N
- • UVIS F673N
- • UVIS F680N
- • UVIS F689M
- • UVIS F763M
- • UVIS F775W
- • UVIS F814W
- • UVIS F845M
- • UVIS F850LP
- • UVIS F953N
- • UVIS FQ232N
- • UVIS FQ243N
- • UVIS FQ378N
- • UVIS FQ387N
- • UVIS FQ422M
- • UVIS FQ436N
- • UVIS FQ437N
- • UVIS FQ492N
- • UVIS FQ508N
- • UVIS FQ575N
- • UVIS FQ619N
- • UVIS FQ634N
- • UVIS FQ672N
- • UVIS FQ674N
- • UVIS FQ727N
- • UVIS FQ750N
- • UVIS FQ889N
- • UVIS FQ906N
- • UVIS FQ924N
- • UVIS FQ937N
- • IR F098M
- • IR F105W
- • IR F110W
- • IR F125W
- • IR F126N
- • IR F127M
- • IR F128N
- • IR F130N
- • IR F132N
- • IR F139M
- • IR F140W
- • IR F153M
- • IR F160W
- • IR F164N
- • IR F167N
- Appendix B: Geometric Distortion
- Appendix C: Dithering and Mosaicking
- Appendix D: Bright-Object Constraints and Image Persistence
-
Appendix E: Reduction and Calibration of WFC3 Data
- • E.1 Overview
- • E.2 The STScI Reduction and Calibration Pipeline
- • E.3 The SMOV Calibration Plan
- • E.4 The Cycle 17 Calibration Plan
- • E.5 The Cycle 18 Calibration Plan
- • E.6 The Cycle 19 Calibration Plan
- • E.7 The Cycle 20 Calibration Plan
- • E.8 The Cycle 21 Calibration Plan
- • E.9 The Cycle 22 Calibration Plan
- • E.10 The Cycle 23 Calibration Plan
- • E.11 The Cycle 24 Calibration Plan
- • E.12 The Cycle 25 Calibration Plan
- • E.13 The Cycle 26 Calibration Plan
- • E.14 The Cycle 27 Calibration Plan
- • E.15 The Cycle 28 Calibration Plan
- • E.16 The Cycle 29 Calibration Plan
- • E.17 The Cycle 30 Calibration Plan
- • E.18 The Cycle 31 Calibration Plan
- • E.19 The Cycle 32 Calibration Plan
- • E.20 The Cycle 33 Calibration Plan
- • Glossary